TRAK Solutions
Plan Participant Solutions
Batch Processing
Many advisors dread participant meetings, and so do many participants. If you are starting to feel that dreadful feeling in the pit of your stomach, keep reading because you can engage and motivate plan participants like never before with TRAK’s Batch Processing solution. With these Batch Processing tools, you can quickly give retirement plan participants a meaningful report illustrating their contributions and impact on retirement and answering their most important question: “Am I ready to retire?”
TRAK-Online’s Batch Processing solution comprises three reports, generated after importing census data and then a few clicks of the mouse.
- Participant Gap Report
- Contribution Analysis Report
- Participant Benchmark
The Participant Gap and Contribution Analysis report both focus on the participant. In addition, they are advisor-driven, allowing you to provide each participant with a customized report with their personal information rather than providing participants with less-than-helpful generic data or asking them to log onto the plans web portal after the meeting.
The Participant Benchmark is a report that provides the plan sponsors key participant metrics and shows how the participant retirement readiness is improving on your watch.
A Participants’ most crucial question is “Am I ready to retire?” with TRAK’s Participant Gap Report, you can be the advisor who is finally able to answer that question.
Participant Gap Report
Participant meetings and participant education doesn’t need to be bland or generic. With the right approach, advisors can engage plan participants, motivate them to increase deferrals, and have the opportunity to discover outside assets to bring into the plan. In addition, the right approach means connecting with and engaging participants personally with relevant and meaningful information and answering their most important questions.
The Participant Gap Report provides a one-page analysis report for participants that answers the question, “Can I retire?” This easy-to-understand report engages participants because it uses their personal information. When participants see their current paycheck numbers, this sparks their attention. Providing suggested shortfall solutions and how those affect their take-home pay provides meaningful education and helps participants understand the decision they have to make. In addition, they can examine their retirement account funding and how closing a potential shortfall gap will impact their take-home pay.
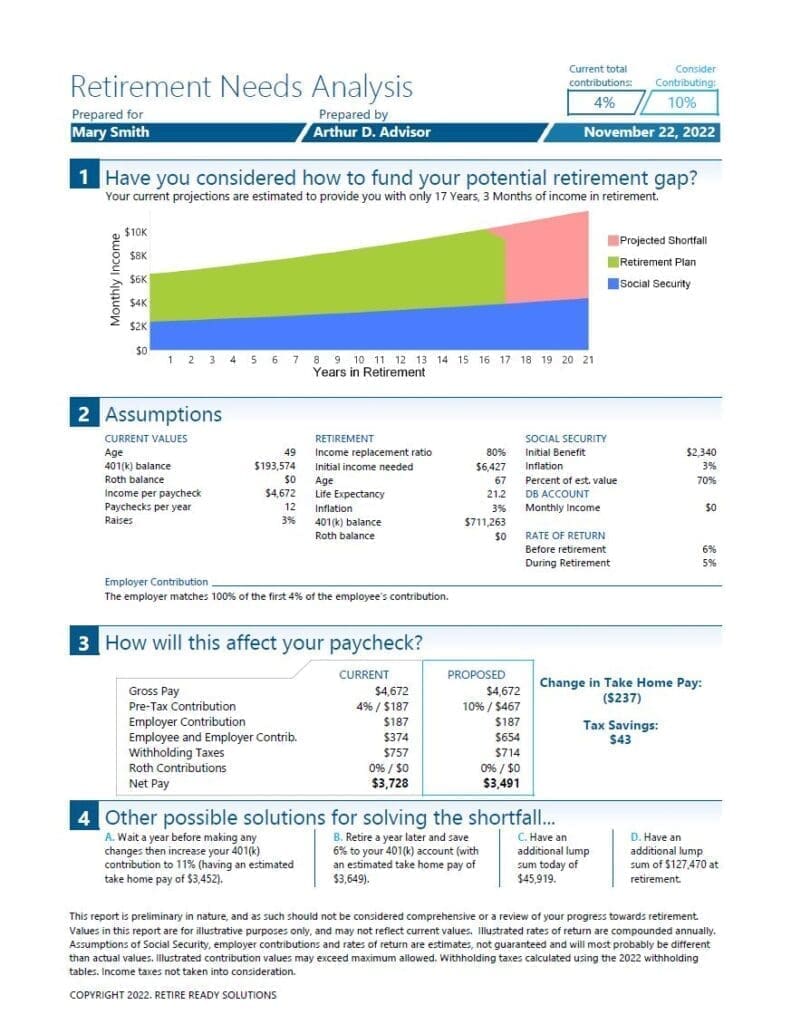
Let’s look at the Participant Gap Report and highlight some key areas. First, the chart at the top allows the Participant to see their current retirement funding in a meaningful way. If there is a shortfall, the report will describe how many years of retirement income they have. Then, below the chart, the report will provide a suggested contribution increase to eliminate that shortfall.
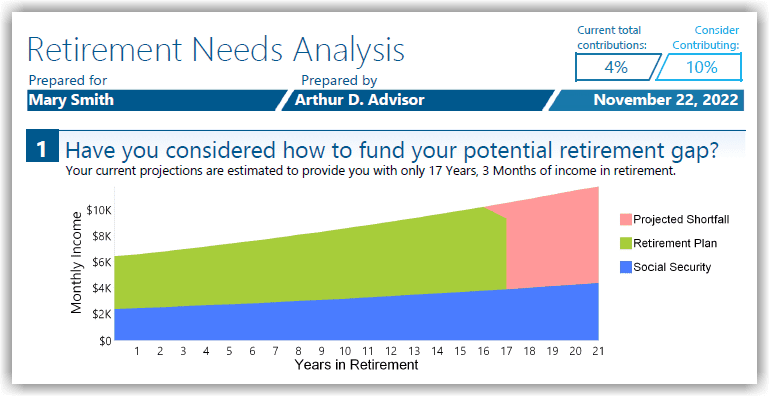
Second, the report will show the assumptions being used to build this report.
Allowing the client to confirm you are working with their data and provide any corrections or changes if something is not lining up.
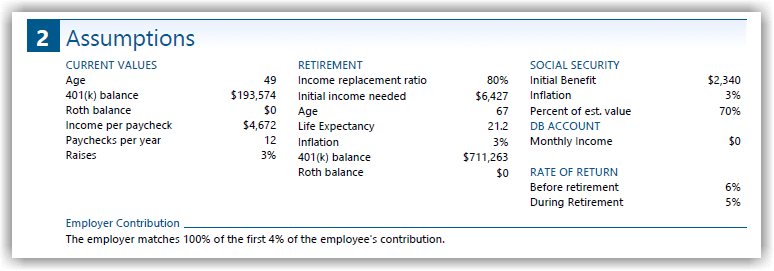
Third, the report shows the Participant’s current paycheck data and the proposed change if there is a shortfall to resolve.
The proposed data will include the increase in contributions and the change in Take Home Pay which is usually the most important to your client.

Forth, the report presents other possible solutions for funding retirement, including the cost of waiting before increasing contributions, retiring a year later, or if they have additional assets outside of their retirement plan.

For significantly underfunded clients, the calculation engine has configurations to modify the scenario to reduce a shortfall automatically. For example, it could increase the client’s retirement age until the increase in contribution falls within a specific threshold. If the data is modified, a footnote will record the change. Similar functionality can also be applied to the calculation engine for overfunded Participants.
The Participant Gap report provides a meaningful, quick assessment of how prepared a plan participant is for retirement. If not prepared, the report offers the available options for addressing the projected gap shortfall.
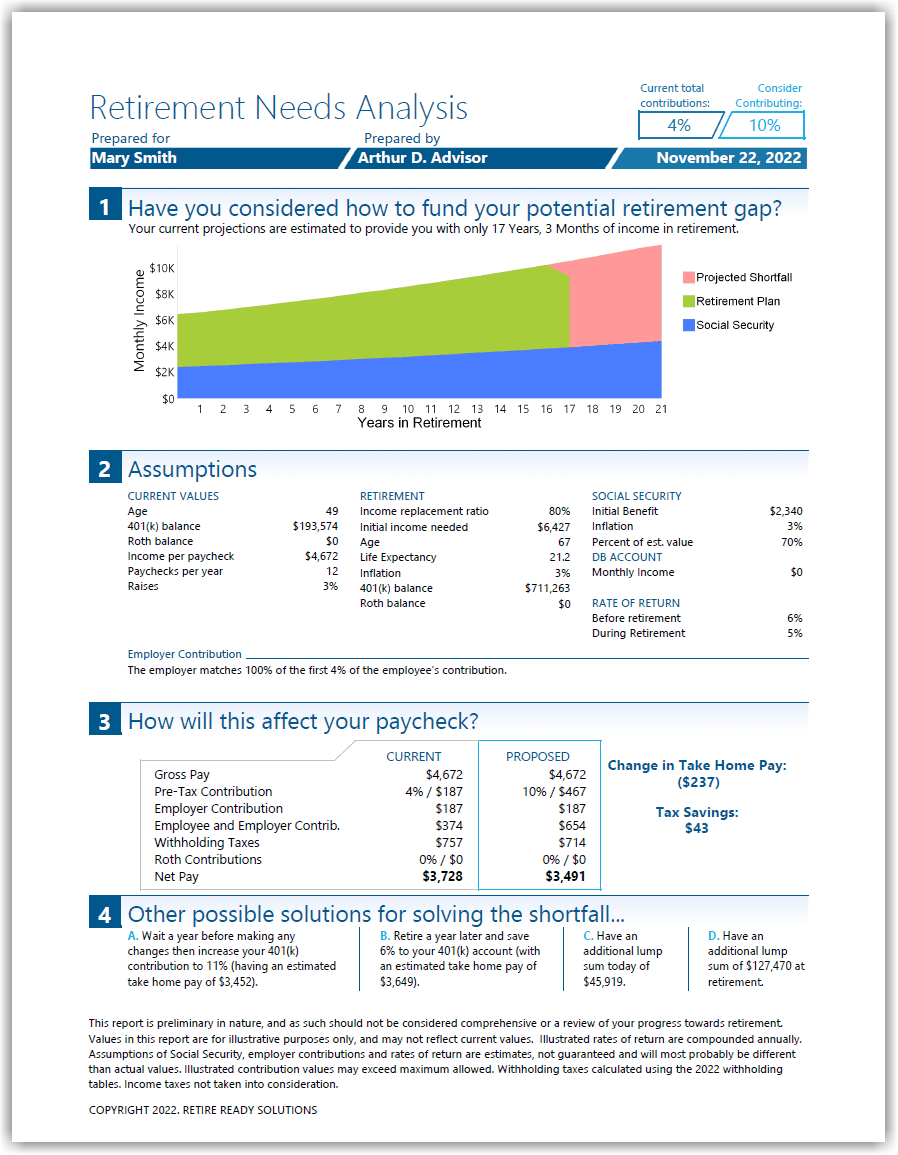
Below is a Full one-page Participant Gap Report example in one of our three layout options. You can download this example report or click the free trial button in the top right corner to start for yourself!
Contribution Analysis Report
When a participant sees that they will need to make a big jump in their contribution to be ready for retirement, this can be discouraging and demotivating. TRAK’s Contribution Analysis Report can help plan participants to take incremental steps to reach their retirement goals. This report illustrates to plan participants’ different contribution levels and how those gradual changes might be projected into retirement—seeing these incremental steps can help participants better understand their options. If they can’t increase their contribution significantly, this report helps motivate them to take smaller steps to move forward.
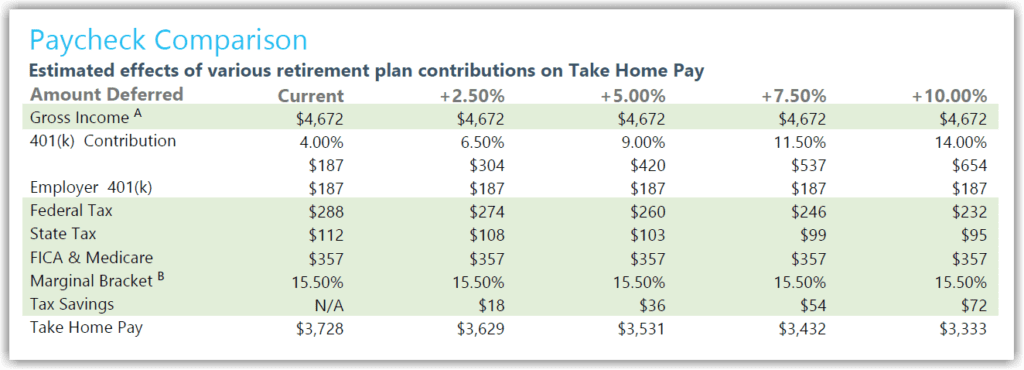
Let’s take a look at TRAK’s Contribution Analysis Report and highlight some key areas. First, the report starts by calculating a client’s paycheck (including tax withholdings), allowing Participants to connect with their personal information. Then, moving on from their current situation, the report illustrates the impact of increased contributions on the client’s paycheck. Also, the illustrated increase in contributions can be configured as needed and display yearly deferral increases, such as in a plan with auto-escalation.
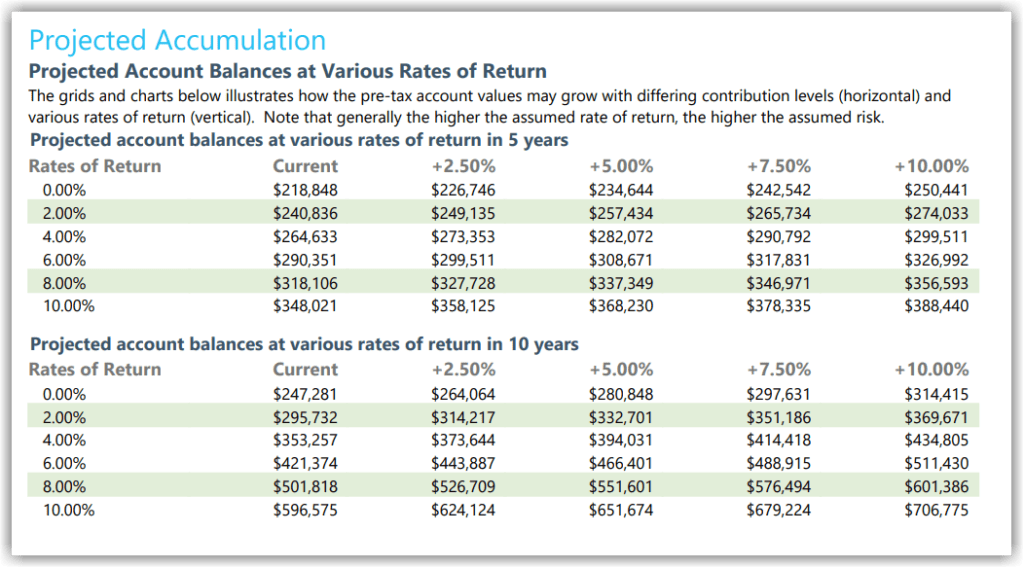
The report can illustrate how the increased contributions grow over time at various rates of return (e.g., 5 years, 10 years and at retirement).
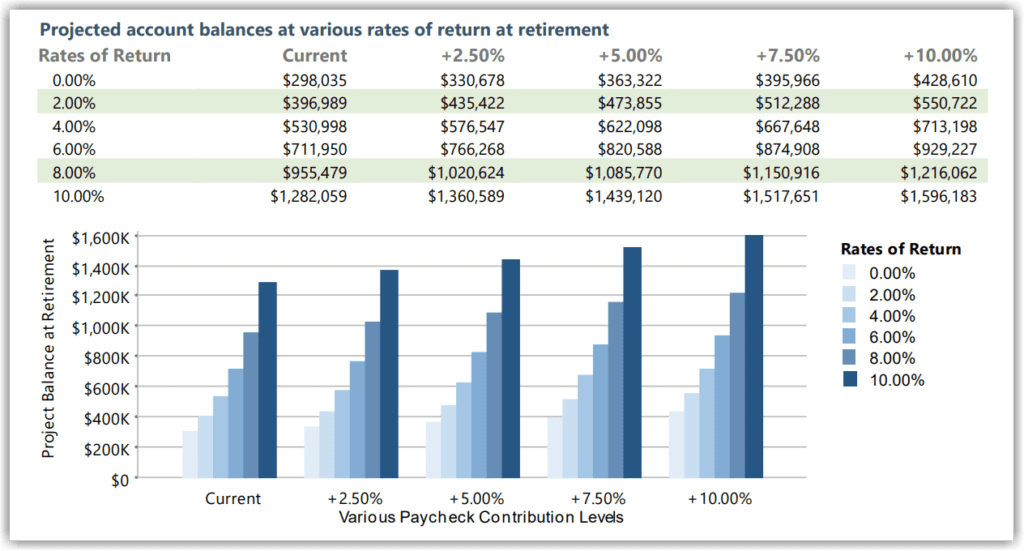
Additionally, the report can illustrate the impact on the projected retirement account balance at retirement if the client should wait before increasing the amount of his or her contributions.

Finally, the report can illustrate the income stream from the projected account balances at retirement at 5 years and at 10 years.

Some advisors have objected to the wealth of information provided in this report. Please note that the amount of comparisons and data points can be adjusted. However, once advisors use this report, they often respond differently. Plan participants can understand the report because the calculations are based on their paycheck. You are helping them connect with their data and providing the tools to understand the communicated suggestions.
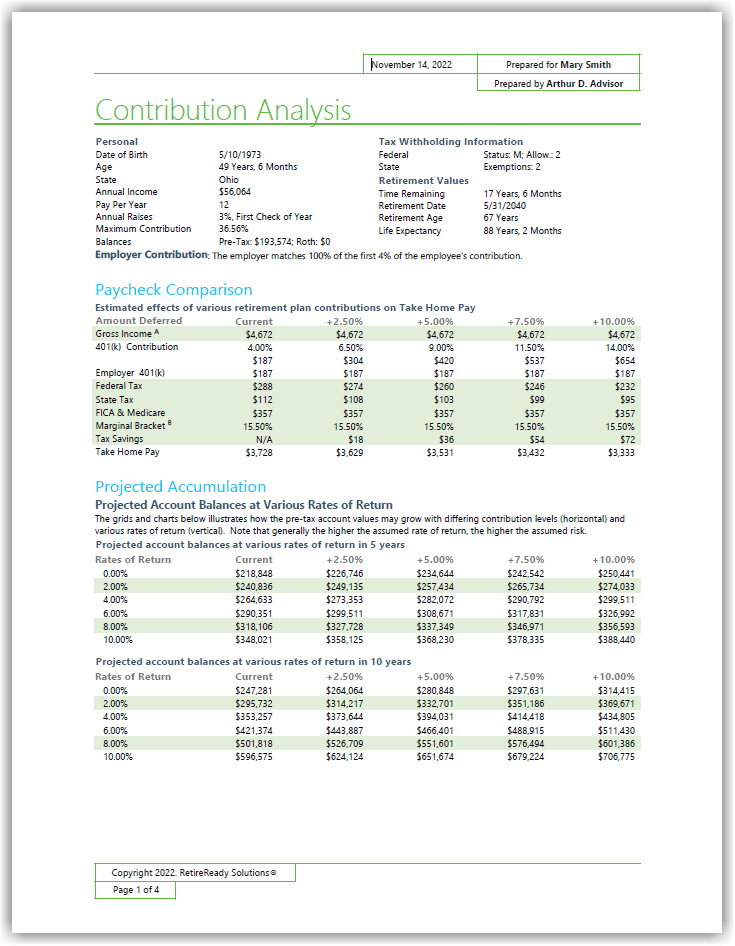
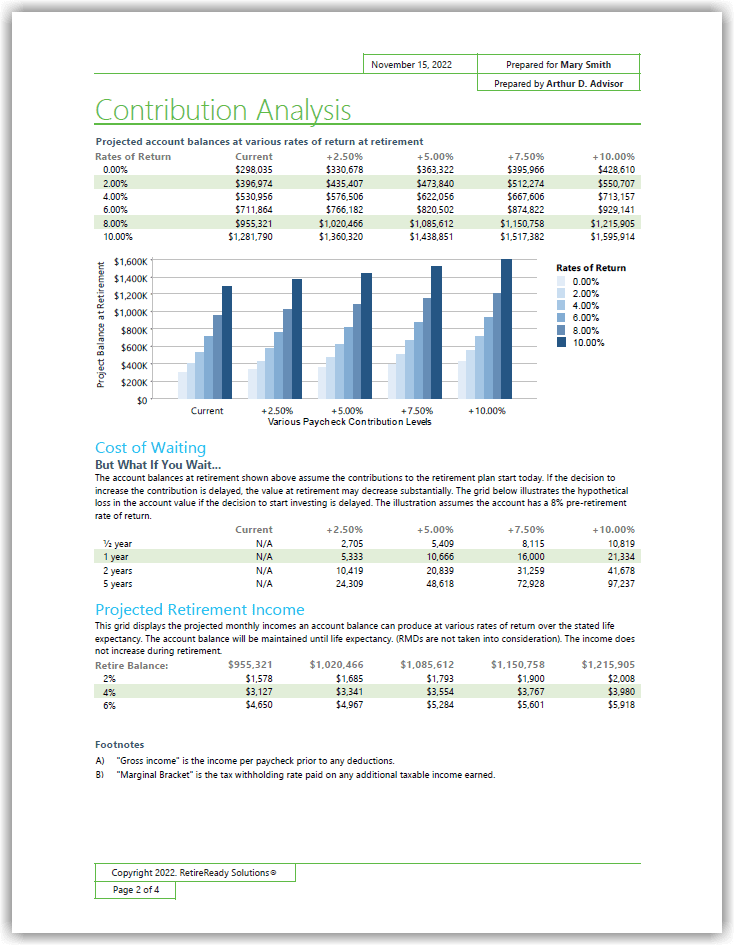
The Contribution Analysis report is an excellent solution for an enrollment or re-enrollment meeting. It helps clients quickly comprehend the impacts of increasing contributions not only on their paycheck, but also in retirement.
Using the Participant Gap and Contribution Analysis reports together provides a practical set of tools for helping advisors educate plan participants for retirement. So help your participants start taking steps to a successful retirement today!
Participant Benchmark Report
The growth of defined contribution plans over the last few decades has been exponential. As more advisors market their services to plan sponsors, it becomes increasingly difficult for advisors to differentiate themselves and their services from the rest of the pack. Without providing unique, value-added services to plan sponsors, advisors may find it difficult to prove that they are having an impact on plan participation. Advisors can distinguish themselves by providing the reports plan sponsors really want to see using TRAK-Online’s Participant Benchmark report allows them to rise above the competition and give plan sponsors the data they want and need.
The Participant Benchmark report is designed to be given to plan sponsors. Rather than focusing on plan fees and investment options, both important metrics, the Participant Benchmark report focuses on the participants themselves. How many are participating? What are the average contributions and balances? What is the projected retirement income replacement ratio? These data sets and more can then be further segmented by age and income level. Historical data can also be incorporated into the report allowing an advisor to demonstrate to the plan sponsor how participation and contributions have grown over time. The Participant Benchmark report includes more than 15 charts and grids that can be included, excluded, and reordered as needed.

Stand out from the crowd by providing plan sponsors key participant metrics and showing how the participant retirement readiness is improving on your watch. Stand out by using TRAK’s Participant Benchmark report.
TRAK Solutions
