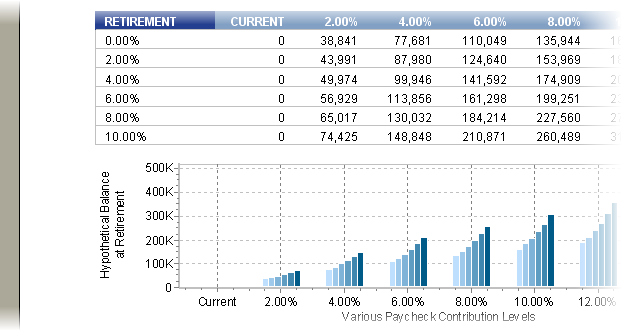
The projection section of the report (shown below) displays how various contribution levels grow over time at differing rates of return.

The Batch Paycheck projection section (shown above) is configured in the Accumulation tab (shown below).

Accumulation Tab Prompts
Each of the prompts on the Accumulation tab is discussed below:
Start on New Page
Determines if the Projections section of the report starts on a new page.
Show Retirement Year
Determines if the retirement year should be shown in the report. Note that "Cost to Wait" and "Payout" are only available if Show retirement year is checked.
Use Value for Raises Configured in the Employer File
Determines if employer raises will be used for projecting increases in contributions to the retirement plan. If not checked, the value entered for Annual raise will be used.
Annual Raise
This prompt is only available if the raise from the employer file is not used. Enter the annual raise to be used in the report.
Method to Display Projected Values
Determines how the projections are displayed in the report: Chart (shows graphically), Grid (shows actual values), or Both (shows both the chart and grid).
At Retirement, Show Both Grid and Chart
Allows for displaying both the grid and chart at retirement, thereby highlighting the retirement year. Only enabled if Both is not selected for Method to Display Projected Values prompt.
Roth Account Balance
If a Roth account is included in the illustration (on the Paycheck tab) it determines how the Roth account balance is displayed in the report. The following image is a sample of how the accumulations values are shown if Include with Pretax is selected.

If Show Below Pretax is selected, a sample of the accumulation grid that includes illustrates a Roth account is shown below.

| Note: | While having the values separated may be profitable, this may add unwanted length to the printed report. |
When displaying charts, the chart will either display a chart with only one bar, or with a stacked bar having a blue line for the pretax account and a green bar for the Roth account (see image below).

Hide Years Within 'X' Years of Retirement
Allows for removing accumulation years that are close to retirement. For example, if the client is retiring in 10.5 years, and 10 years is entered as a projection year, a value of '1' here will hide the 10th year (i.e. it is one year within retirement).
Number of Interest Rates
Enter the number of interest rates to display in the projection grid. This will determine the number of records (rows) displayed in the Years grid.
Show Accumulation Years in Addition to the Retirement Year
Determines if additional years are displayed with the retirement year. Note that this is only enabled if the 'Show retirement year' checkbox is marked.
Number of Accumulation Years to Show
Determines the number of sections for years. For example, to display accumulation years 5 and 10, enter the value '2' here, then in the Years tab (to the right), enter the value '5' and '10.'
Rates
This grid configures which interest rates are displayed in each accumulation year. Also configurable are which rates of return in the accumulation are used to display Cost to Wait and Payout illustration sections.
| Note: | Selecting to illustrate the Cost To Wait or Payout for many or all of the Cost to Wait and/or years may significantly increase the length of the report. |
Years
This grid configures which years are printed in the report for accumulation periods. Depending upon the configuration, some years may be hidden if they are beyond retirement.
