Overview
The Contribution Analysis illustration tool can quickly create custom qualified plan contribution illustrations (including 401(k), 457, 403(b), etc.) for a group or an individual. The report may be configured at various levels, including:
1.For the paycheck, how much detail is shown (e.g. include detailed or summarized taxation information), and what contribution levels are illustrated.
2.In accumulation, the rates of return and number of years, including retirement, that are to be shown.
3.The option to illustrate Cost to Wait, including specific years.
4.The payout methods used, and the rates of return to be illustrated for payout.
The reports are configured in the Batch Paycheck Report Layout Editor.
Examples of various sections of the Batch Paycheck report are shown below:
Contribution Analysis Report
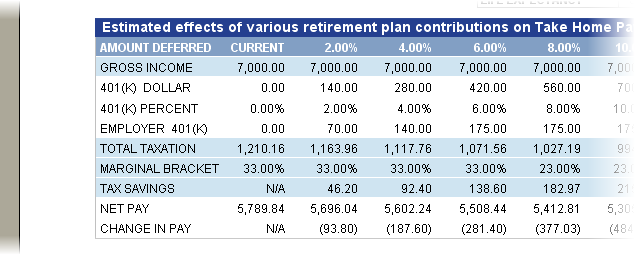
The Contribution Analysis report presents the effects that various levels of contributions have on a client's paycheck. It shows taxation (shown below as a total, but may also be shown in detail; see the Report Layout Editor's Paycheck Tab), marginal tax bracket, tax savings, employer matching contribution to the retirement plan, and change in pay.

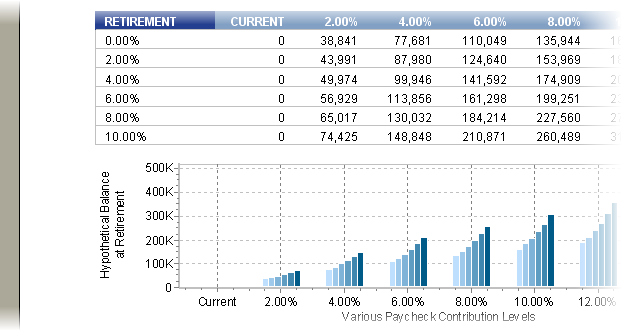
How those contributions grow at various rates of return (selectable) until retirement, including various periods of time before retirement, can be demonstrated in a grid or chart (or both, as shown below):

The cost to wait, if the participant so chooses, before increasing their qualified plan contribution:

And also how the hypothetical accumulated account value would payout over life expectancy:

The Batch Paycheck may be configured in the Report Layout Editor to change the values which are to be illustrated.
