The Retirement Years chart's Display Options represent settings for the chart that are more typically changed (verses the Chart Config docking panel). Each setting is discussed below.
Include Income From Accounts Above the Client's Need
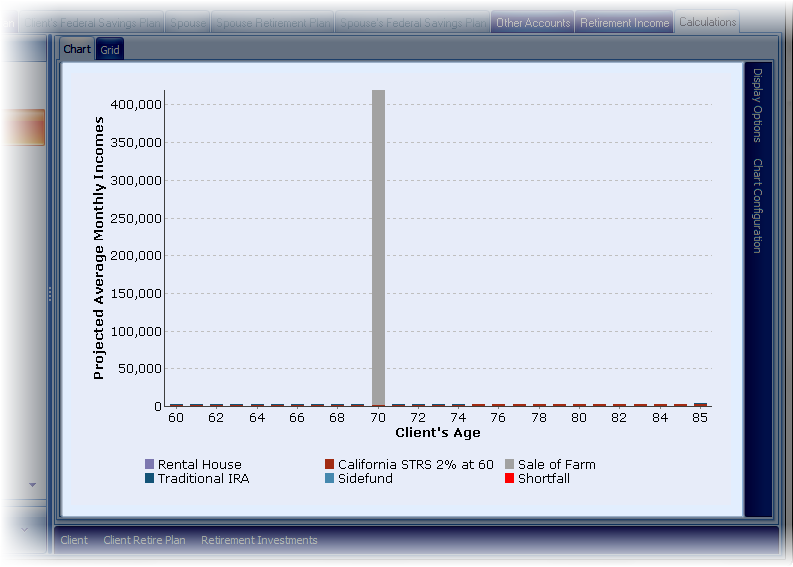
When income exceeds need, by default the income is not displayed in the Retirement Years chart (it will be displayed in the grid). The reasons is that large lump sum distributions (such as the sale of an asset) can make this chart meaningless. For example, if the box is checked and there is a large sale (as the chart below shows the Sale of Farm at 70), the chart becomes meaningless.

Checking this box will display the excess incomes, otherwise incomes above the need is not included in the chart.
Display Values
Select the values to be included in the grid: Incomes, Balances or Both (the later displaying two charts)
Display Mode
Select either Income by Account or Simplified. Simplified shows income verses shortfall, simplifying what the chart displays.
Chart Type
Select Multi-Year or Single Year. Single Year will shows a pie chart of a specific year and a scroll bar at the bottom can be used to scroll through the various years. Note that a specifc year can be selected in the multi-year chart by clicking on a specific bar.
Income (Vertical) Axis
Select if the chart is to display Average Monthly Values or Annual Income for income in the visible chart.
