PMaxCalcTabCashFlowGrid
The Pension Max Cash Flow Analysis-Grid displays the year-by-year values for the Pension Max calculation.

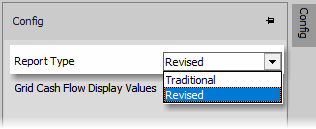
Config
Report Type
Select the report type for the printed illustration. The traditional is more of a basic layout and the revised contains a more detailed view.

Grid Cash Flow Display Values
To switch between monthly and annual values for the grid view of the cash flow illustration, select the desired value.

