Lump Sum Calculations
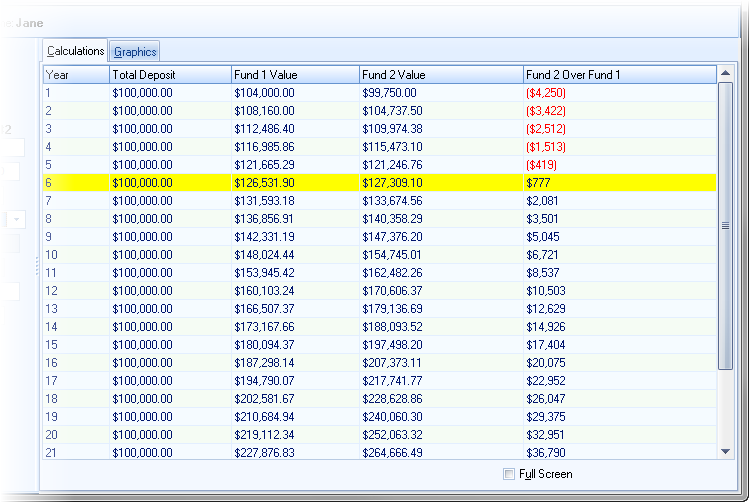
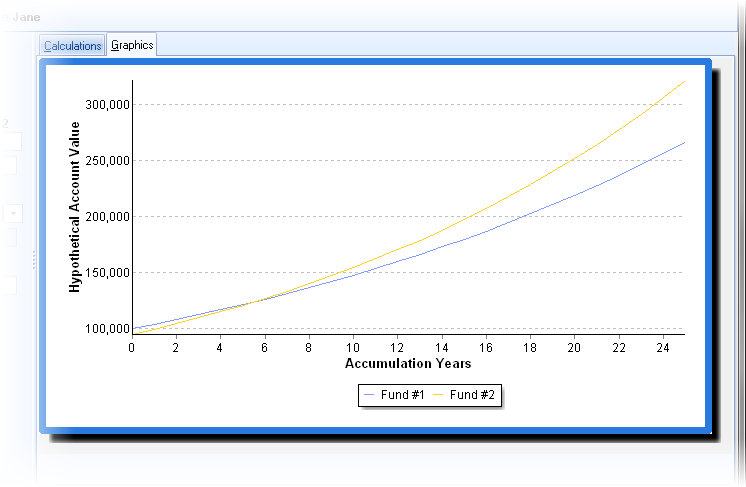
The calculations are displayed on the right, in both grid and graphical forms (See the two examples below.):

Note: The yellow bar in the grid shows the year that Account 2 is greater than Account 1.

Lump Sum Calculations
The calculations are displayed on the right, in both grid and graphical forms (See the two examples below.):

Note: The yellow bar in the grid shows the year that Account 2 is greater than Account 1.
