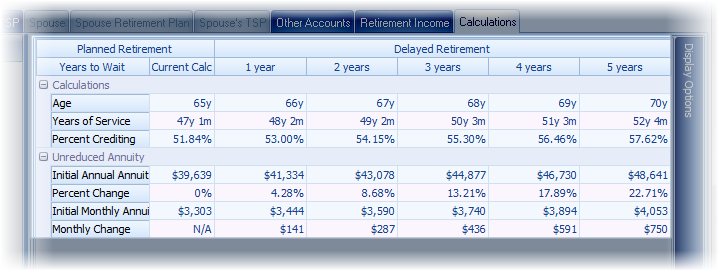
The "Option Values at Various Ages" shows the effect on a defined benefit plan of delaying retirement for a selected number of years. The controls at the top of the calculation page configure what data is displayed in the grid below (and also determines what appears in the report that corresponds to this calculation page).

The grid can be configured using the Display Options docking panel found to the right of the grid.
