Bucket Strategy
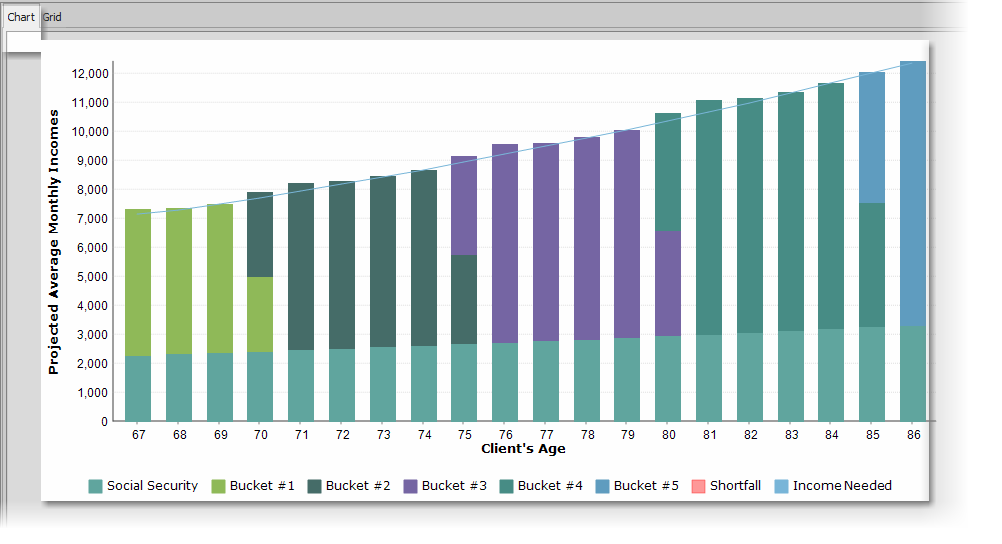
Once the buckets have been configured, there are illustrations available in the Calculations reports for “Retirement Years” both the chart and grid view tabs. Viewable now on the grid includes any flex income for handling changes in the COLA if configured.


Additionally, there is a report titled “Bucket Strategy” which displays the new income allocation strategy for the client.

The report provides several illustrations including:
1. Overview – providing a graphical representation of the buckets using a view similar to the multi-tier annuity illustration:

2. Grid – for more of a detailed spreadsheet summary:

3. Account Cash Flow - allowing grid views of both accumulation and distribution calculations for each allocation and the option to show annual or monthly values:

4. Funding:

The reports are then available to be printed:

