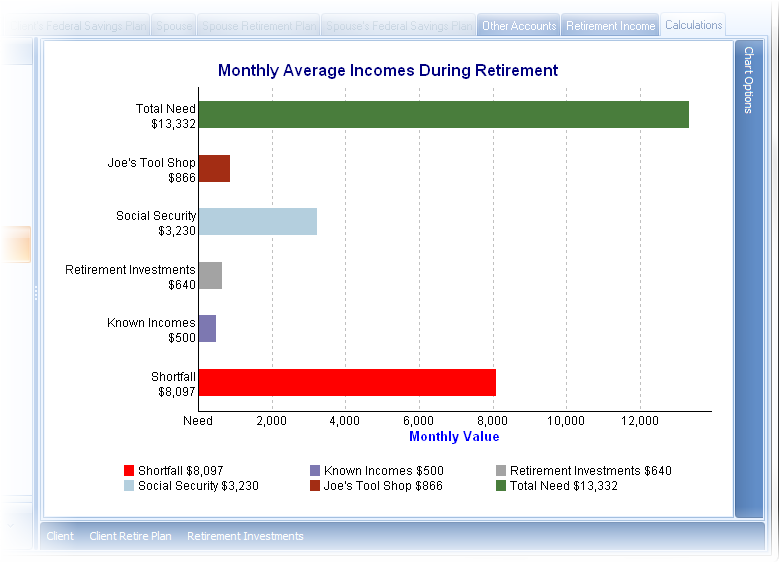
The Average Values screen graphically displays the client and spouse's retirement needs, incomes and shortfall. The bars on the chart vary according to what accounts the client and spouse have.
| Note: | These are average values during all retirement years. If an account that pays out during retirement changes during retirement, or if there is a spouse and the income is not paid out all retirement months, the value may vary from the monthly payout made by the account. |

