Side Fund Example #2

Contents
Suppose Ashley retiring at age 60 with two sources of income in retirement: a $3,000 monthly benefit from California STRS and an annual $30,000 benefit from a lifetime income rider paid out in September. A 3% inflation rate is used for retirement COLA. Her initial monthly need in retirement is $5,000. The Retirement Years chart appears as follows:

The chart displays a shortfall the first year and additional shortfall starting at age 79. Several questions could be asked about this:
1.Why isn't there more income from the guaranteed income rider?
2.And why so much income from the Side Fund and so little from the known income rider?
3.And, why does the shortfall happen in later years in retirement?
4.Why is there a shortfall the first two years of retirement?
5.Why is the last year so different then the previous years?
To determine what is happening, several areas could be looked at:
1.First, clicking on the "Include income from accounts above the client's need" (under the "Display Options") and be sure "Include Income-Needed Line is checked" (under "Chart Configuration") to see where all of the income is needed for the year. This shows a significant increase in the known income rider, but also displays the side fund providing a sizable income as well. (In Step 3 below, we will examine this in more detail).
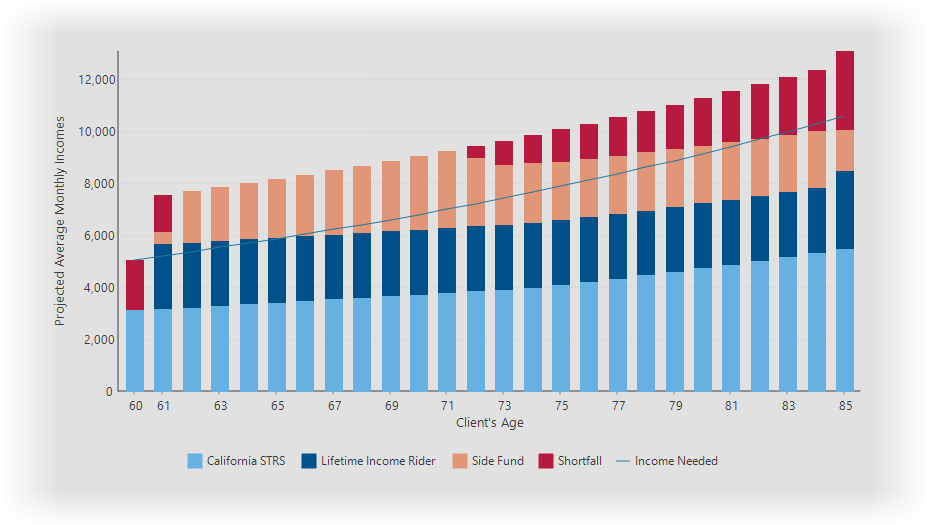
This shows the guaranteed income rider (answering question #1), but not only does not address the other questions, it seems to add to the confusion. That will require looking at a few more views.
2.Next look at the balance grid may provide some clues. To view account balances in the chart, click on the "Balances" button in the Display Options docking panel. This will provide an overview of what is happening with the account balances at the end of each calendar year during the retirement.
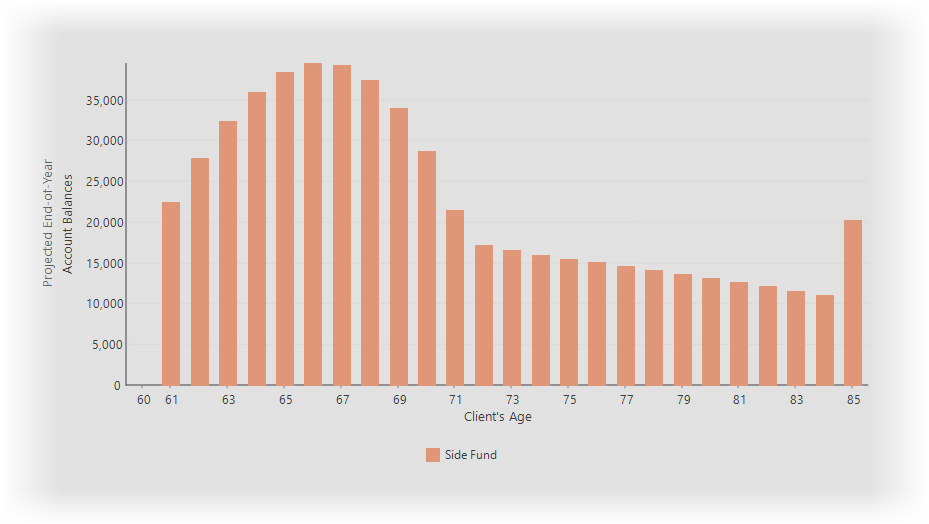
The retirement years balance chart above shows the increasing balances in the early years of retirement, but displays what may be unexpected results during the later years of retirement. Again, this chart does not help clarify what is happening during retirement.
3.Under the hood, TRAK handles the retirement cash flow on a monthly basis. When the charts display what might be unusual or unanticipated results, often viewing the values on a monthly basis will answer questions raised by other views.
To do this, click on "Grid" tab near the top of the "Retirement Years" page. Next click on Grid Options/Display Values/Monthly to display the monthly cash flow grid. For this example, a grid similar to what is shown below should be display.

The grid above provides the solution to why the shortfall is displayed the first couple years of retirement: the income from the pension is insufficient for the clients need, and they must rely on the guaranteed income rider, but the income rider does not provide revenue until September after the first year in retirement. This causes the shortfall for the first ten months of retirement. In September, the income from the income rider account provides enough cash balance to last from year to year--and a little extra left over every year and will help fund the COLA.
Scrolling down through the grid will show the fluctuating balance of the Side Fund balance. There is no balance in August, right before the lump sum payment in September. In September, the excess income is deposited to the Side Fund, but as the year progresses, the account is needed for income. Eventually, there is a shortfall in income.
4.Finally, what is happening in the balance chart at the end of retirement? To see these values, scroll to the bottom of the Retirement Years grid. The grid below shows the values for this example.

This answers the final question: what is happening with the account balance at the end of retirement. In the chart above, we can see how the September cash flow is deposited into the Side Fund and accounts for about six months of income. This provides a little balance at the end of each calendar year, but a small shortfall occurs at life expectancy.
Summary
Occasionally retirement cash flow can be confusing. When this occurs clarity is often provided by looking at the monthly values in the grid in the Retirement Years calculation page.