Illustrate a Catastrophic Health Event
TRAK's Gap Analysis can easily illustrate the effect of a catastrophic health event in retirement. An example is shown below.
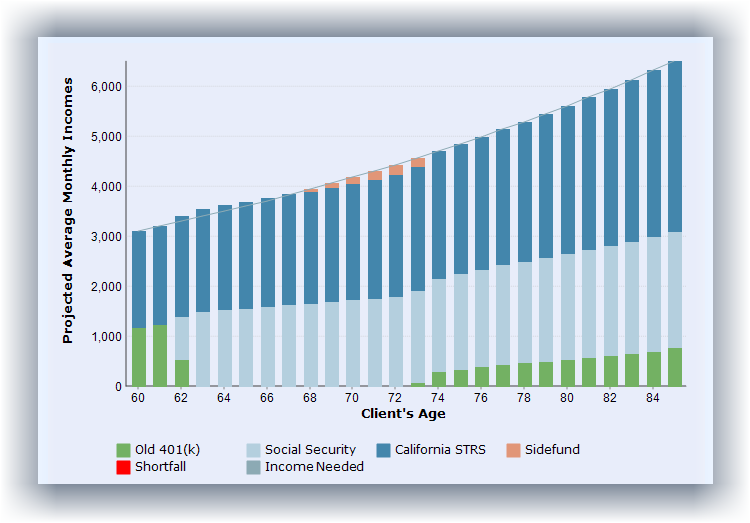
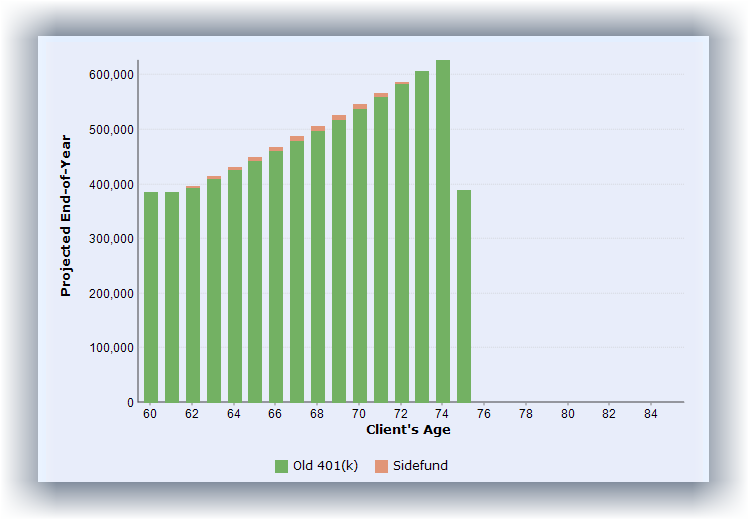
1.Finish a retirement illustration for a client. In the example below, the illustration shows plenty of income for the client and a potential cash balance at retirement close to $900,000.


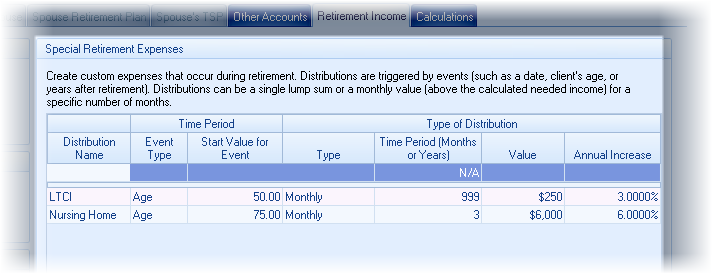
2.Return to the Retirement Income tab and add the costs of a nursing home for the client. Enter the values in today's dollar values. In this example, it illustrates the client needing to enter a nursing home at age 75 for 36 months. The current cost is $6,000 per month and increases 6% annually.

3. Return to the Retirement Years calculation and view the effect of the potential cost of a nursing home on both income and account balance. This dramatically illustrates for the client a significant shortfall of income and loss of retirement savings.


4. Return to the Retirement Income tab and add the costs of a long term care insurance policy. Then change the cost of the nursing home to a 90 day waiting period (3 months). Next, add a long term care policy and include any COLA in the policy. Also be sure the payments are required throughout retirement. The image below illustrates a policy costing $250 per month with a 3% COLA. (An early age is entered and a large number of months illustrates it lasting throughout retirement).

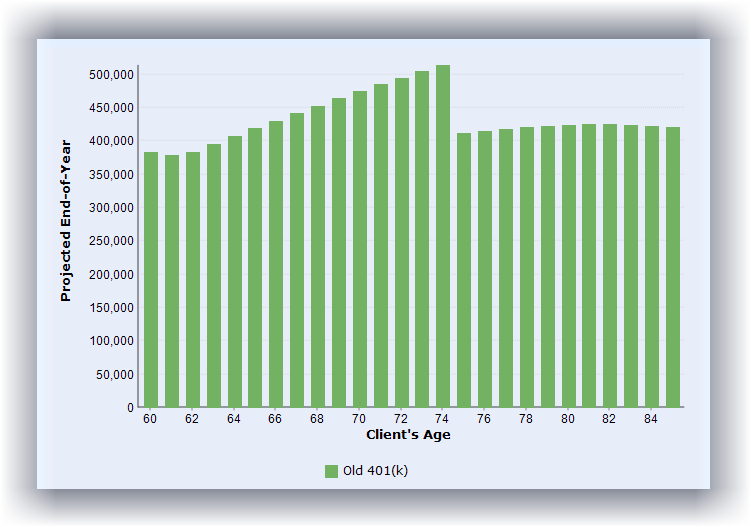
5. Finally, return to the Retirement Years chart and show how the cost of the policy affects the illustration. In this illustration, the client's income is sufficient. The impact of the 90 day waiting period can be seen in the income chart.

The estimated account balance at life expectancy is a bit more than $400,000.

