Retirement Solutions Show Different Savings Needed for Client and Spouse
In the Retirement Solutions tab various savings solutions can be displayed based on different assumptions, including cost of waiting before increasing savings, retirement ages, etc. The additional savings values can be per paycheck or per month (configured in the Overview's Config panel).
When working with the client and spouse that have the same retirement age, the additional savings needed my be different. Here is an example:
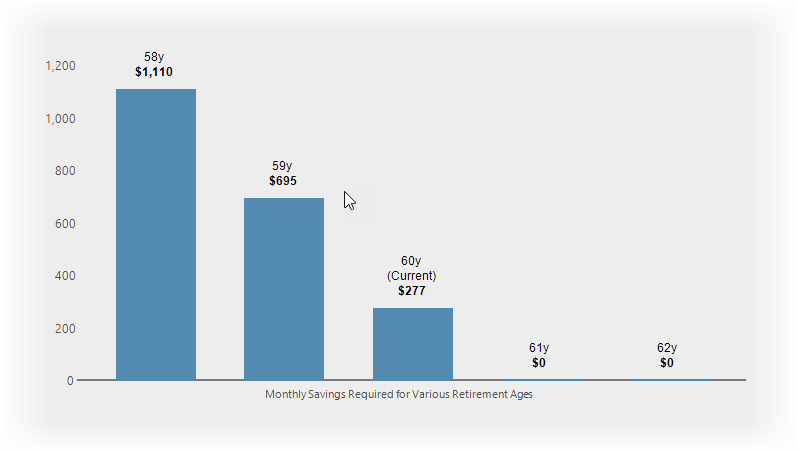
Here is the chart for Retirement Solutions comparing the client's additional savings needed at different retirement ages.

Here is the same chart, with the same retirement age, for the spouse.

Why do the two charts show different values for additional monthly savings needed until retirement?
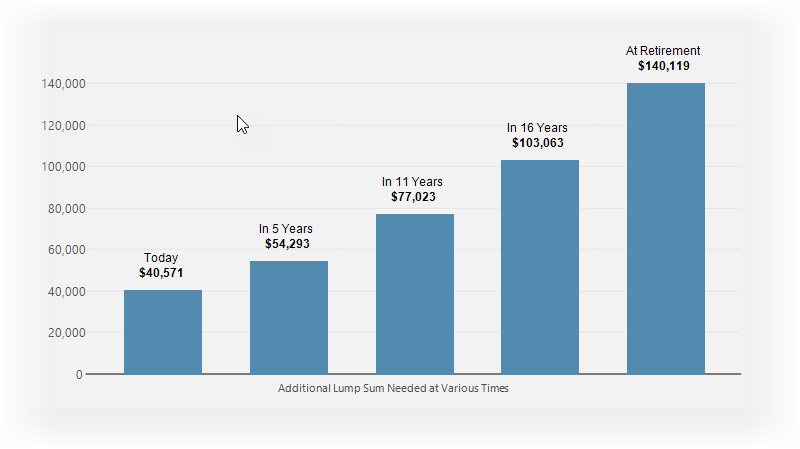
Before jumping into to answering the problem too quickly, let's look at one more comparison chart--the additional lump sum needed at retirement.

The chart are identical for both the client and the spouse. This did not help solve the problem but only made it more confusing.
To solve this problem there are a couple items that should be looked at:
1.Confirm that the additional savings is at the same regularity (e.g. monthly). If the additional monthly savings is per-paycheck and the client and spouse are paid a different number of times per year, then the value can be substantially different. With this situation, both charts clearly state "Monthly Savings..." at the bottom of the chart, so that is not the issue.
2.Check the Side Fund settings, that additional savings is increased per raise. If the raises for the client and spouse are different, then the additional savings will be different. Also, if the client and spouse raises occurs at different times of the year, then additional monthly savings may also differ.
