Chart Options
The Chart Options tab is used to configure the colors used in the Participant Gap Analysis report. Select the respective colors.
Show Client Income Above Need
Check this box to display income above the client's need. For some participants, income may exceed need due to required minimum distributions (RMDs).
Income to Display in Chart
Select to display Monthly or Annual income in the chart.
Chart Colors
Select the color for the specific retirement account.
Shortfall Transparency
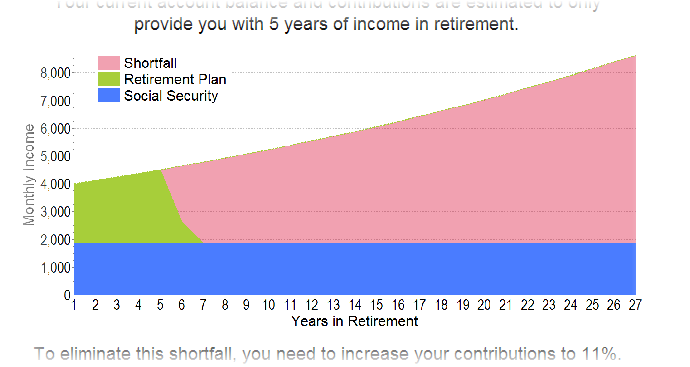
The Shortfall Transparency allows for configuring transparency in the Shortfall account. Creating the appearance of semi-transparency for a shortfall in retirement produces the powerful visual effect of the shortfall being "empty." (Notice on the chart below where the lines can be seen during the shortfall period, but where no income occurs.)
A value of zero ('0') has no transparency, while a value of one hundred ('100') is fully transparent (i.e. no color will appear). As an example, the chart below used 60% transparency.

Show Horizontal Lines in Chart
Select this option to display horizontal lines in the retirement years chart.
Show Lines in Front
This options is only available when Show Horizontal Lines in Chart is checked. This determines if the horizontal lines are displayed in front of the chart, or behind the chart. Note that when transparency is used for the shortfall, the lines may be visible behind the shortfall area of the chart.
