Retirement Budget

Contents
The Retirement Budget calculation screen is available if Retirement Budget is selected as the Method for Calculating Income Needed During Retirement on the Retirement Income tab. The chart displays the desired budget values and does not take into consideration actual income.
What the chart displays can be configured using the "Display Options" docking panel to the right of the chart.
The Chart Type group a single pie chart for either all retirement years or a single year of retirement, or a bar chart representing for each year in retirement. When viewing a pie chart for a single year in retirement (see Figure 1), a tracking bar is displayed below the chart to move through each year in retirement. (The calendar year of retirement is displayed above the pie chart).

Figure 1: Average monthly priority values for a single retirement year.
The values in the chart can display Average Monthly Expenses (Figure 2), Annual Expenses or Percent of Annual Expenses (Figure 3).

Figure 2: Average monthly priority values for each retirement year.
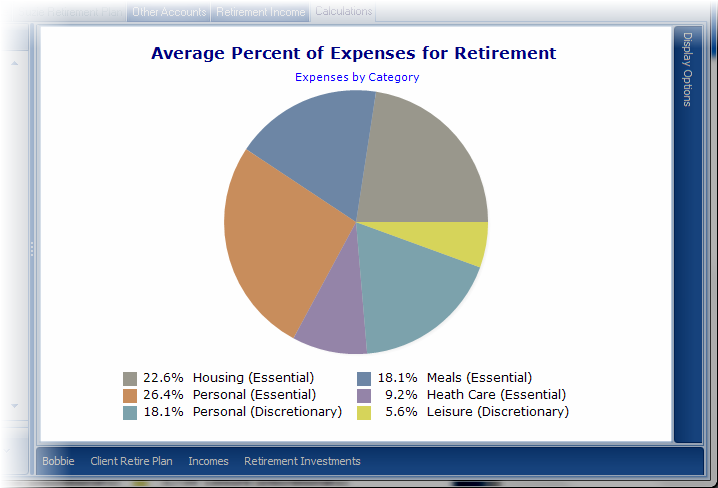
Figure 3: Budget categories as a percent of budget during all of retirement.
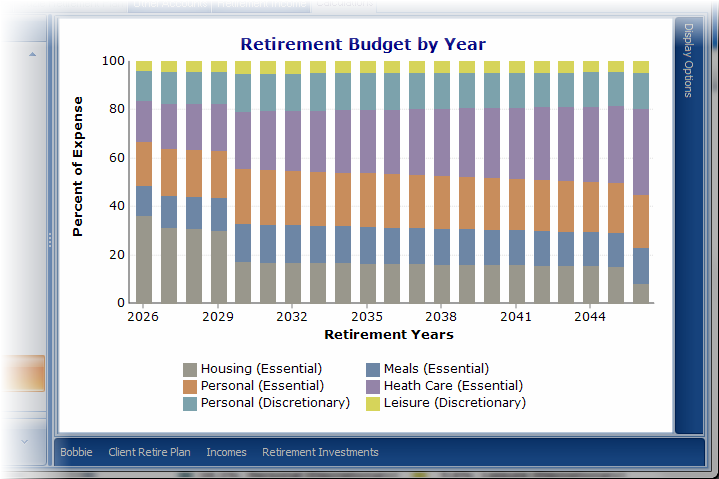
Figure 4: Annual budget categories as a percent of the budget during their respective years.
Charts can also be configured to display values budget item by Priority (Figure 2) ,Category Values (Figure 4 and 5) or Item Values (not displayed).

Figure 5: Average annual expenses by category for a specific retirement year.